If the U.S. economy enters a recession, the causes and potential outcome will be hotly debated. At LPL Research, our starting point is always looking at history. This week’s commentary will remind us of three things we know about historical recessions.
1. Technical Definition
First, a recession has an important technical definition that’s different than what many people think. Earlier this year when Gross Domestic Product (GDP) growth was negative, many were under the false impression that two consecutive quarters of negative GDP make a recession. Often that view is a good general approximation but not the technical definition. The National Bureau of Economic Research (NBER) is the official arbiter of U.S. business cycles, and they consider a wide range of economic indicators other than just the quarterly GDP metric. The official definition of a recession is “a significant decline in economic activity that is spread across the economy and that lasts more than a few months.” [1] Now for most investors, this definition does not sound very specific and raises questions about things like the meaning of “significant.”
The three factors for defining a recession are depth, diffusion, and duration – conveniently referred to as the “three D’s.” Depth refers to declining economic activity that is more than a relatively small change. Diffusion describes an economy that has experienced a contraction in a wide range of sectors, such as trade, business activity, and consumer spending. Duration is likely the least important of the three D’s and measures the time between the previous business cycle peak and the following trough. Given the unique cause of the 2020 recession, the time between peak and trough was the shortest on record – only two months.
2. Warning Signals
Second, warning signals usually precede a recession, and these signals are clearly set forth by NBER. The relevant data for determining the onset of a recession is conveniently categorized at the St. Louis Federal Reserve. [2]
- Consumer metrics, specifically real spending and personal income, give investors an early read on the health of the consumer and are good warning signs.
- Employment activity, as reported by both businesses and households, begin to decline before the onset of a recession.
- Industrial production often stalls near the beginning of a recession, indicating cracks in the business sector.
- Indexes with aggregate economic and financial metrics give early broad-based warnings about market conditions and are historically good leading indicators. The following paragraph explains one of them.
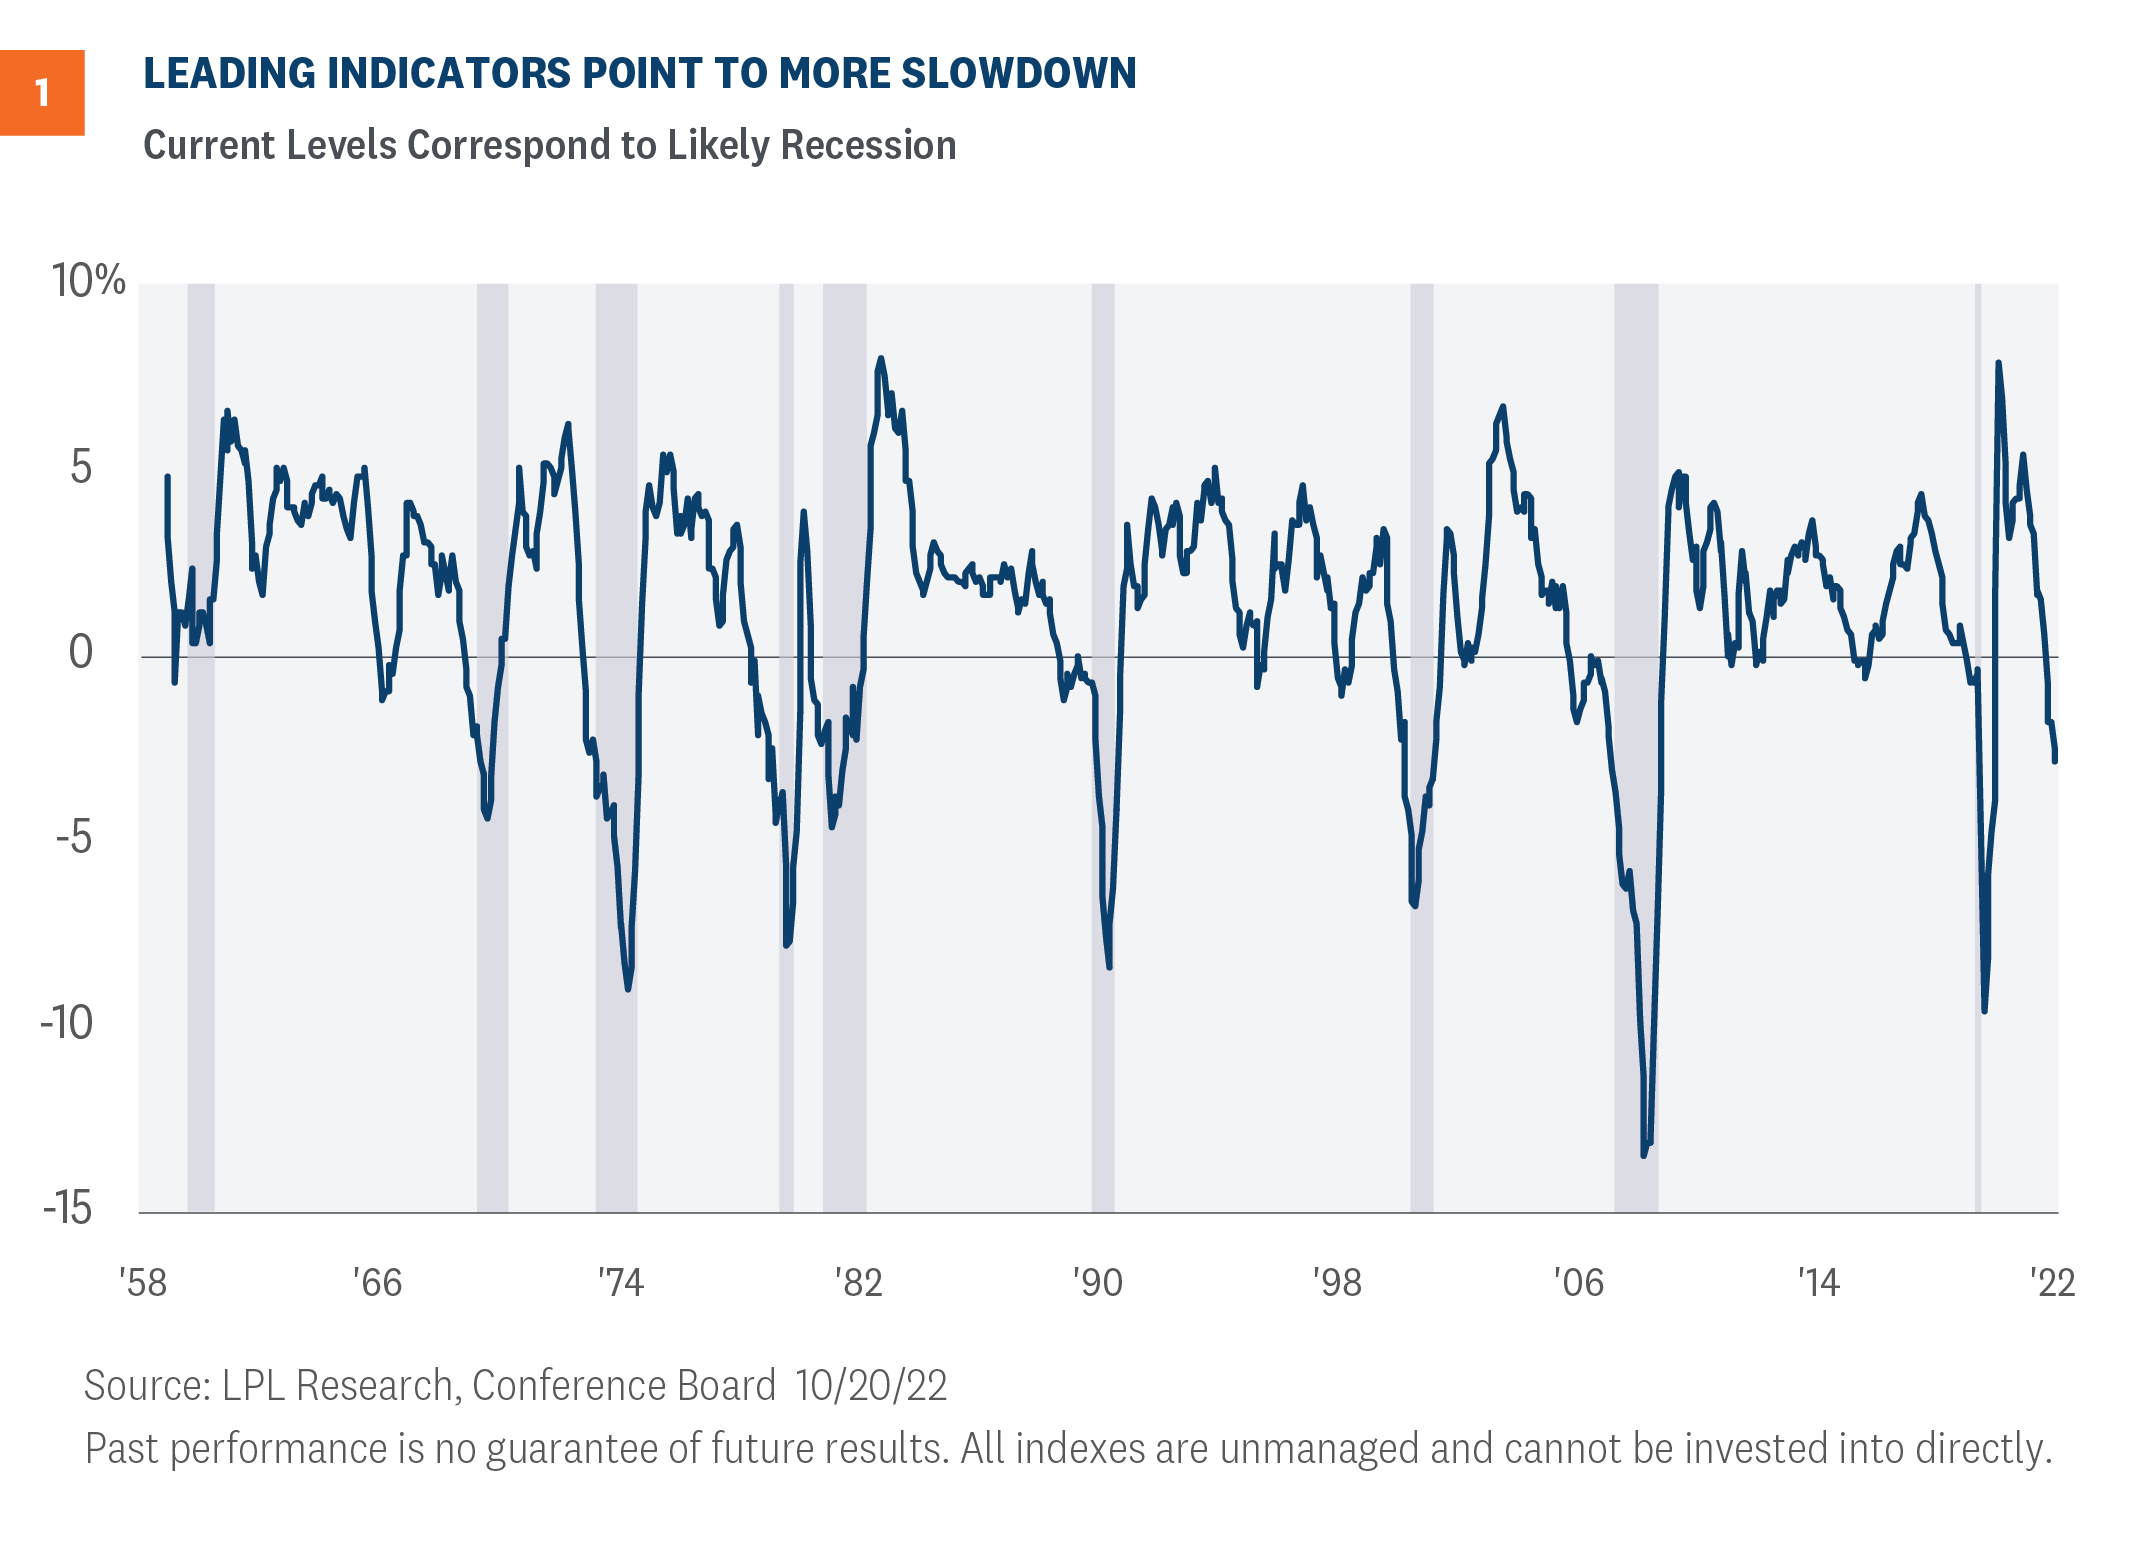
One reason we see healthy debate on the likelihood of recession is that for most of this year, not all metrics were flashing warning signs. However, recent data may give us more clarity. On October 20, the Conference Board released the Leading Economic Index (LEI) and as of September, the LEI had declined seven out of the last nine months, showing that the economy could enter a period of significant and broad-based contraction. The decline is predictable as many sectors, such as housing, started slowing months ago. Since the inception of the index, a decline of this magnitude over a six-month period has always foreshadowed a recession in subsequent quarters [Figure 1]. As such, we think recession risks appear more probable by the beginning of next year. If the economy does fall into a recession, the cause will likely be from the consumer sector retrenching after years of inflationary pressures, high housing costs, and slow real wage growth.

3. Not Perfectly Concurrent
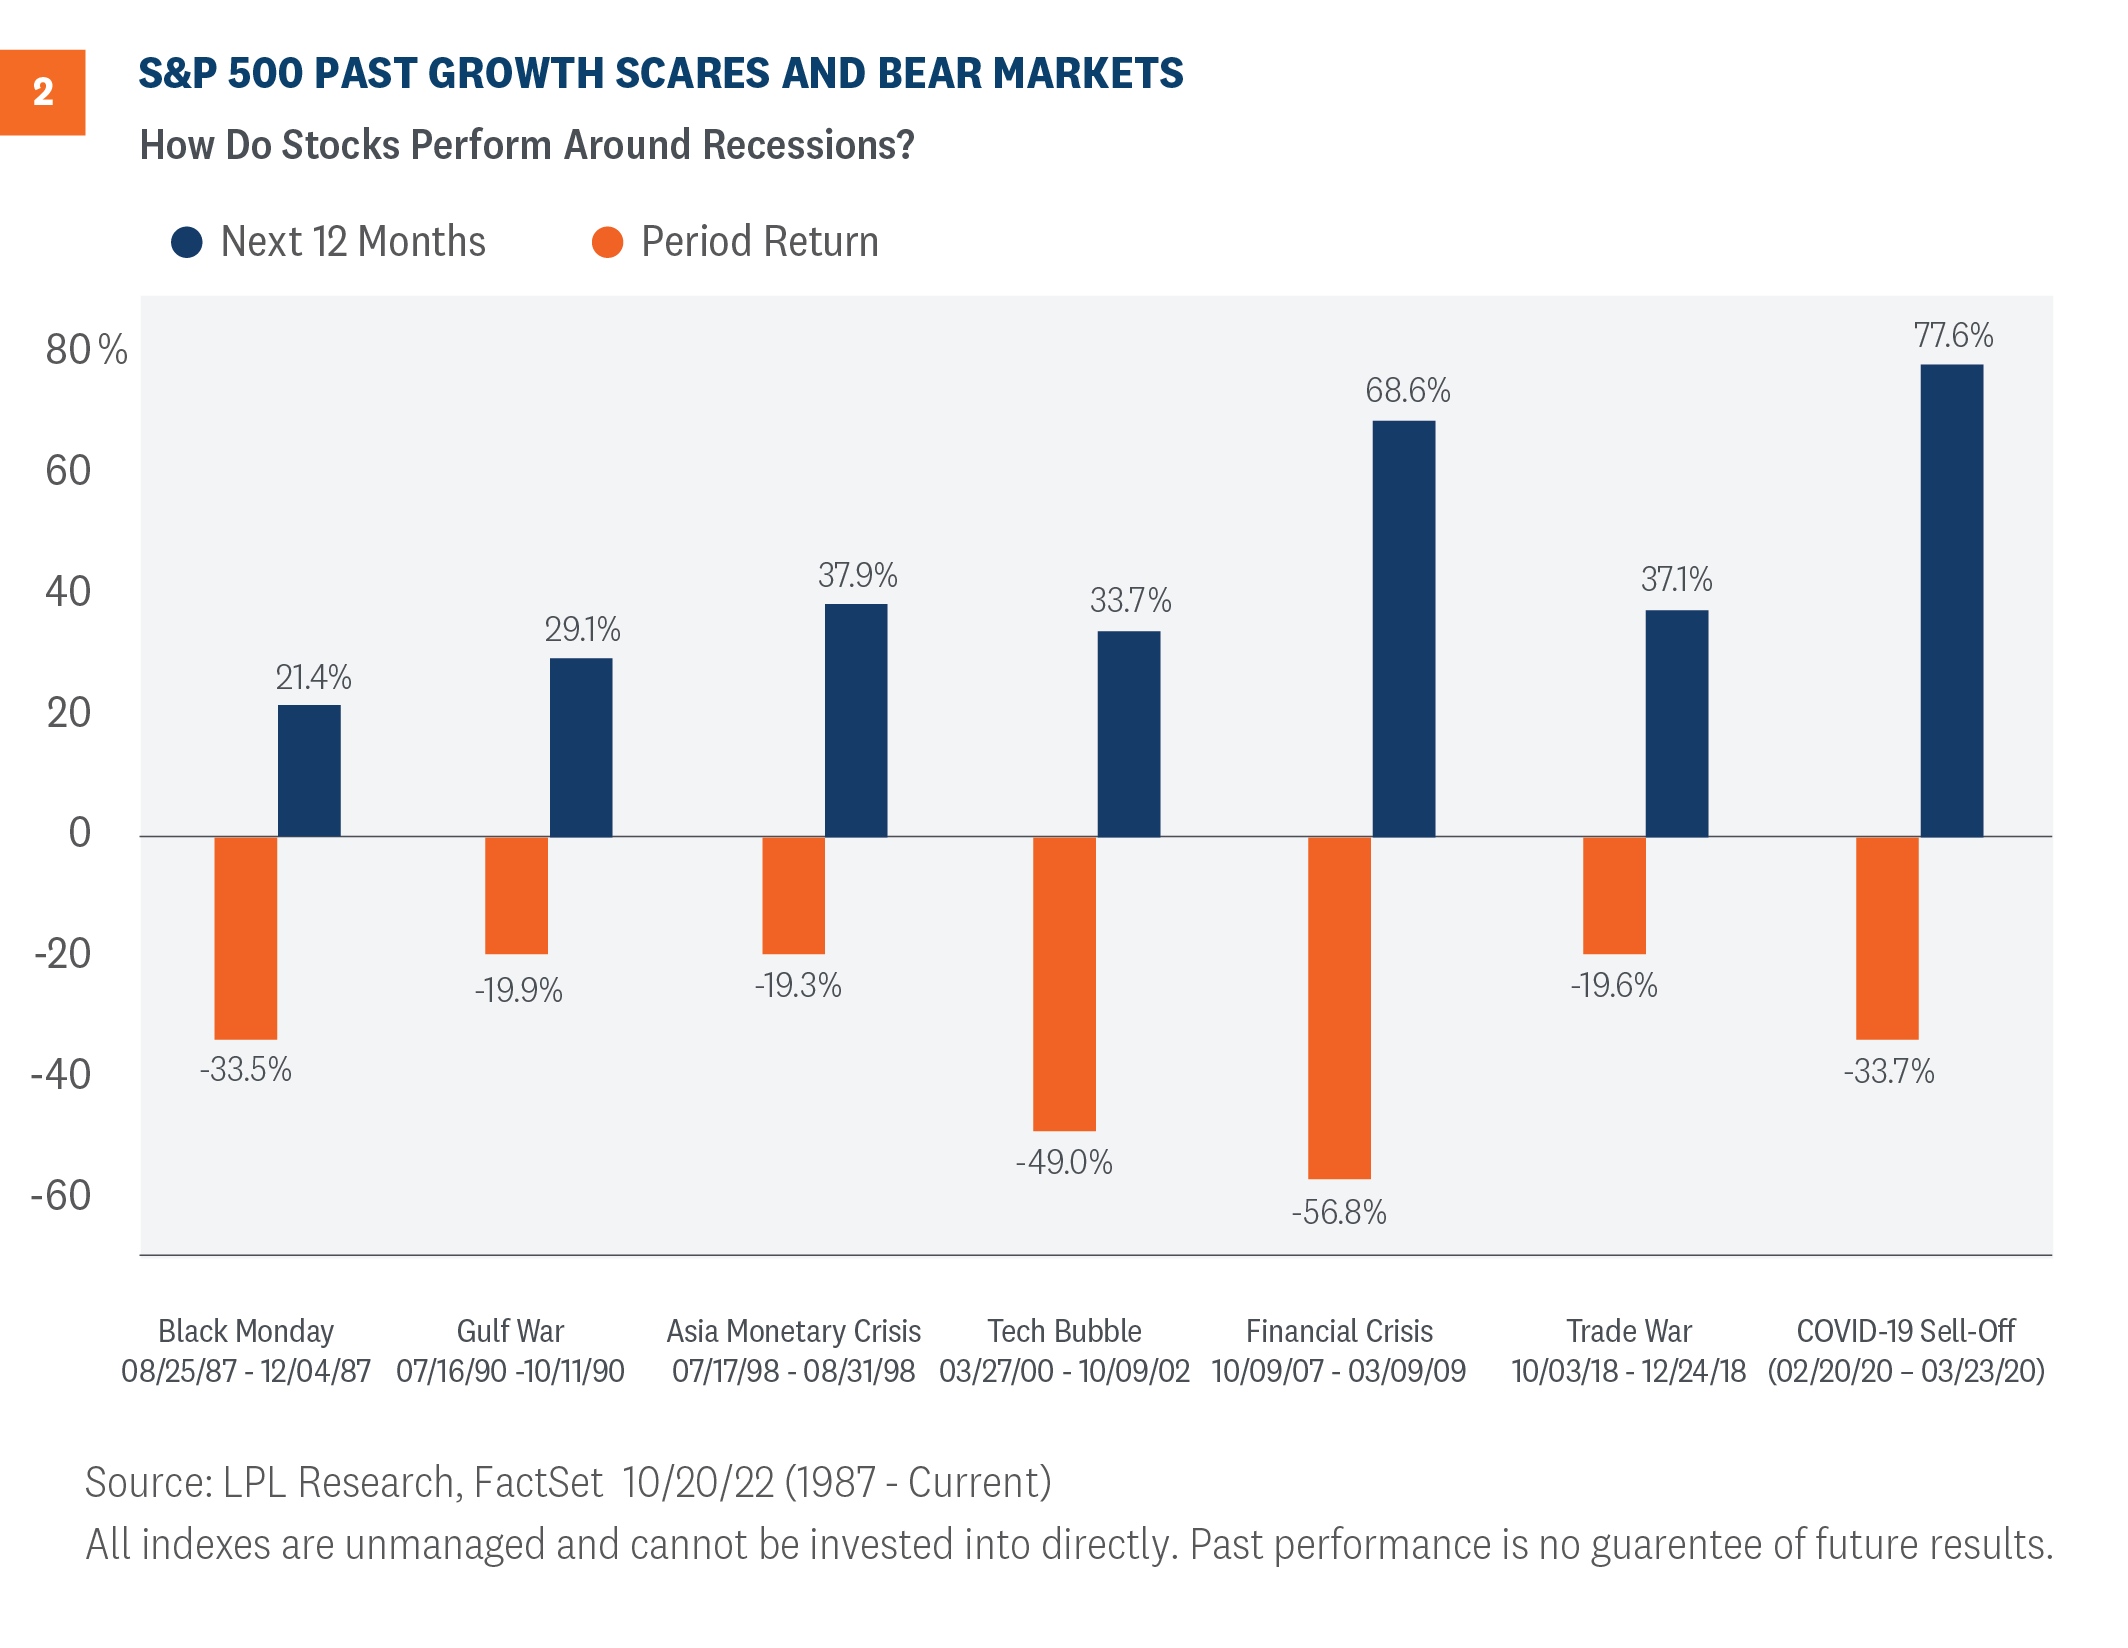
Third and most importantly, recessions historically have not perfectly coincided with market declines. Bear markets, defined by a market decline of at least 20%, and recessions overlap but investors should remind themselves that markets are forward-looking, so current market volatility is often about future recession risk. As predictable as this slowdown is, the markets have likely priced in much of the slowdown but that remains to be seen. Taking a broader look at the markets than just officially designated recessions, in [Figure 2], we show the following 12-month equity returns after a negative shock. History may not repeat itself but it often rhymes, so during these contentious times investors should remind themselves of the three things to know about recession.

Conclusion
Even though investors are tempted to say “this time is different,” we all can take note of general principles about business cycles and the markets. The Federal Reserve (Fed) has warned that the current inflation fight will be painful, so a dip into recession should not be that surprising. As more metrics start blinking red, sticking to long-term investing plans with the guidance from a financial professional is becoming more and more important.
Jeffrey Roach, PhD, Chief Economist, LPL Financial
You may also be interested in:
- Low Bar for Earnings Season Brings Third Quarter Expectations Down – October 17, 2022
- Pockets of Vulnerability Magnified by Monetary Policy – October 10, 2022
- Markets on Watch as Xi Jinping’s Influence to Be Tested in October – October 3, 2022
Click here to download a PDF of this report.
IMPORTANT DISCLOSURES
This material is for general information only and is not intended to provide specific advice or recommendations for any individual. There is no assurance that the views or strategies discussed are suitable for all investors or will yield positive outcomes. Investing involves risks including possible loss of principal. Any economic forecasts set forth may not develop as predicted and are subject to change.
References to markets, asset classes, and sectors are generally regarding the corresponding market index. Indexes are unmanaged statistical composites and cannot be invested into directly. Index performance is not indicative of the performance of any investment and do not reflect fees, expenses, or sales charges. All performance referenced is historical and is no guarantee of future results.
Any company names noted herein are for educational purposes only and not an indication of trading intent or a solicitation of their products or services. LPL Financial doesn’t provide research on individual equities.
All information is believed to be from reliable sources; however, LPL Financial makes no representation as to its completeness or accuracy.
US Treasuries may be considered “safe haven” investments but do carry some degree of risk including interest rate, credit, and market risk. Bonds are subject to market and interest rate risk if sold prior to maturity. Bond values will decline as interest rates rise and bonds are subject to availability and change in price.
The Standard & Poor’s 500 Index (S&P500) is a capitalization-weighted index of 500 stocks designed to measure performance of the broad domestic economy through changes in the aggregate market value of 500 stocks representing all major industries.
The PE ratio (price-to-earnings ratio) is a measure of the price paid for a share relative to the annual net income or profit earned by the firm per share. It is a financial ratio used for valuation: a higher PE ratio means that investors are paying more for each unit of net income, so the stock is more expensive compared to one with lower PE ratio.
Earnings per share (EPS) is the portion of a company’s profit allocated to each outstanding share of common stock. EPS serves as an indicator of a company’s profitability. Earnings per share is generally considered to be the single most important variable in determining a share’s price. It is also a major component used to calculate the price-to-earnings valuation ratio.
All index data from FactSet.
This research material has been prepared by LPL Financial LLC.
Securities and advisory services offered through LPL Financial (LPL), a registered inv estment advisor and broker -dealer (member FINRA/SIPC). Insurance products are offered through LPL or its licensed affiliates. To the extent you are receiving investment a dvice from a separately registered independent investment advisor that is not an LPL affiliate, please note LPL makes no representation with respect to such entity.
Not Insured by FDIC/NCUA or Any Other Government Agency | Not Bank/Credit Union Guaranteed | Not Bank/Credit Union Deposits or Obligations | May Lose Value
RES-1310750-1022 | For Public Use | Tracking # 1-05340859 (Exp. 10/23)


