With the stock market in record-high territory and up about 35% off the April lows, market participants clearly haven’t been too scared lately. But that doesn’t mean there aren’t plenty of things to worry about. Just because risks haven’t affected markets much lately — subprime auto loan bankruptcies notwithstanding — doesn’t mean they won’t in the future. In that “spirit,” as Halloween approaches, we discuss what scares us about the economy and financial markets.
Scare #1: Late Cycle Economy
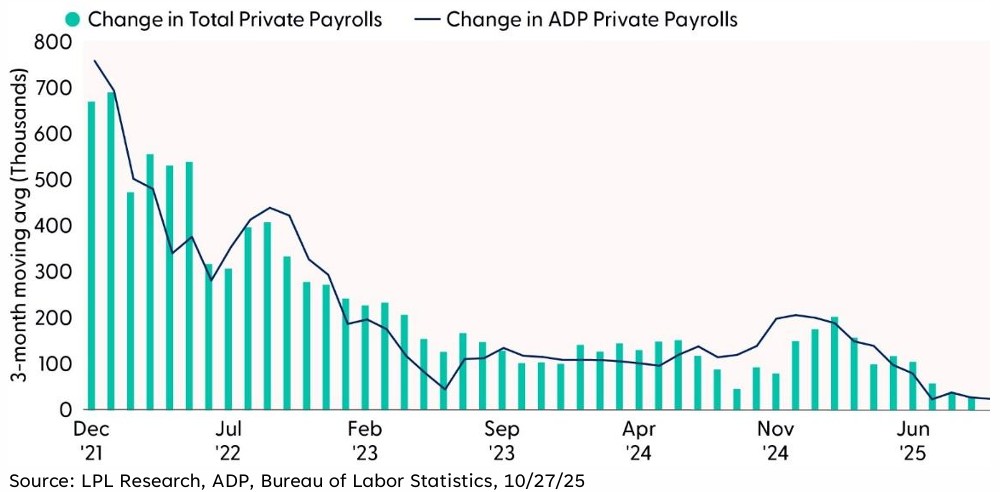
Even though we do not have all the official government data on the labor market, it’s no surprise that the U.S. labor market appears to be approaching stall speed. What’s concerning is the potential that the labor market goes one step further in the wrong direction and cuts jobs. Now it’s nearing stall speed, a condition where job growth slows to a level insufficient to keep pace with population growth, which does raise recession risks. Historically, hiring slowdowns have been among the earliest indicators of economic downturns because employment drives consumer spending, which accounts for nearly 70% of GDP. When businesses curb hiring, household income growth stalls, confidence erodes, and spending contracts, creating a feedback loop that can deepen economic weakness. Past episodes, such as the 2001 and 2008 recessions, showed that sustained declines in job creation often preceded broader contractions in output and investment. The latest official data released prior to the government shutdown suggests the labor market is losing momentum, even as unemployment edges higher from historic lows. Private data such as the ADP report showed further slowing. If hiring remains subdued, unemployment could climb, triggering a vicious cycle of reduced consumption and further layoffs. This dynamic underscores why policymakers, including the Federal Reserve (Fed), view labor market health as critical to sustaining economic growth and have signaled further rate cuts to counteract these risks.
Job Growth Heading to Stall Speed
Scare #2: Stock Valuations Are Near Late-1990s Dotcom Boom Peak
There’s been a lot of bubble talk recently, given the strong gains in artificial intelligence (AI) stocks and expansion and concentration of the technology sector — at an all-time-high ~35% weighting in the S&P 500. Coupled with rallies in momentum stocks and unprofitable companies, many have drawn comparisons between this market environment and the dotcom boom of the late 1990s.
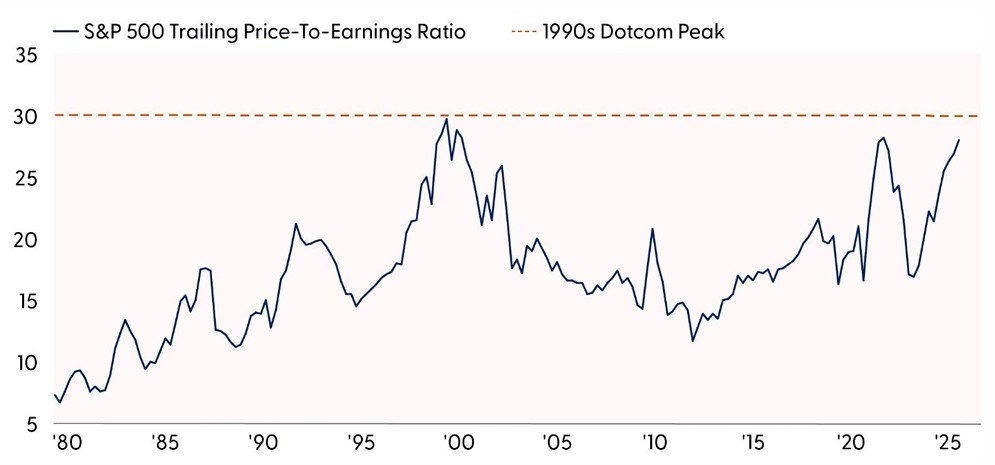
We’ll save that debate for future publication. Using a basic valuation approach with the price-to-earnings ratio (P/E) for the S&P 500 on a trailing four-quarter basis, we find that the index currently trades at a P/E of 28, very close to the 1990s dotcom peak around 30 and well above the respective 10-, 20-, and 40-year averages of 21.1, 18.4, and 18.3.
Perhaps most concerning about the high P/E is that it may augur very modest long-term returns. We wrote about this concept around this time last year in an LPL Research blog post. While valuations are not good short-term market timing tools, they have historically been good predictors of long-term stock returns. This relationship points to low single-digit total returns for stocks through 2035 — a scary proposition if that’s all we get.
One counterargument is that we’ve entered a new regime of productivity thanks to AI that may drive structural improvements in corporate profitability. Higher returns on invested capital from technological advancements could enable stocks to outperform this relationship, although anything better than mid-single-digit annualized returns over the next 10 years would surprise us.
Stock Valuations Nearing Late-1990s Dotcom Boom Peak
Note: Series represents operating earnings excluding non-recurring and non-operating items.
Source: LPL Research, FactSet, 10/23/25
Disclosures: Indexes are unmanaged and cannot be invested in directly. Past performance is no guarantee of future results.
Scare #3: Surging Margin Balances
NYSE margin debt has surged more than 32% since the end of April. The acceleration in the use of leverage exceeds what was seen during the major market run-ups in the late 1990s, the mid-2000s, and the post-COVID period. When you take the embedded leverage into account within things such as zero days to expiration (ODTE) options and leveraged exchange-traded funds (ETFs) — both of which have continued to only gain in popularity — the actual level of speculative leverage in the market is likely far higher than margin debt figures alone would suggest. Historically, such dramatic increases in the use of leverage have tended to mark poor entry points for equity investors, as they often preceded periods of drawdown and heightened volatility.
Leverage Surge Exceeds That of Late-1990s, Mid-2000s, and Post-COVID Periods
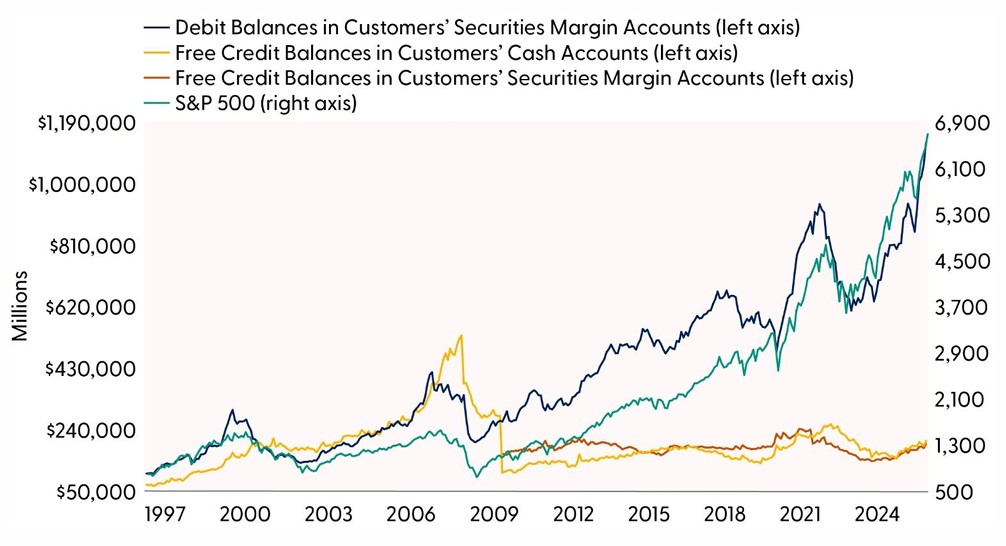
Source: LPL Research, Bloomberg, FINRA, 10/22/25
Indexes are unmanaged and cannot be invested in directly. Past performance is no guarantee of future results.
Scare #4: Five More Fed Rate Cuts Could Be “Scary” For Bond Markets
As we wrote in last year’s Halloween missive, the scariest thing for bond investors is the sheer scale of U.S. Treasury debt — now exceeding $38 trillion and projected to grow by $2 trillion annually. Moreover, developed market sovereign debt levels are projected to surpass $64 trillion this year, according to Fitch Ratings. This figure represents approximately 115% of GDP across the largest developed economies, marking a dramatic increase from around $25 trillion in 2007. And while developed market debt levels will likely be the scariest thing for bond investors for years to come, the immediate focus for bond investors may be what’s priced into markets for Fed rate cut expectations. Markets expect the Fed to cut rates five more times (including this week), which would take the fed funds rate below 3% by the end of next year, despite the Fed itself expecting inflation to remain elevated.
The prospect of five additional Fed rate cuts may sound like a boon for borrowers and equity markets, but for bond investors, it could be a double-edged sword. If the Fed aggressively lowers the fed funds rate to below 3% while inflation remains above its 2% target, it risks unsettling inflation expectations.
The Fed’s credibility partly hinges on its commitment to price stability. Cutting rates five more times in a still inflationary environment could send a signal that the central bank is prioritizing growth over inflation control. This risks un-anchoring inflation expectations, potentially leading to higher long-term yields as investors demand greater compensation for inflation risk. In such a scenario, the bond market may begin to price in a future where inflation is not just persistent but potentially accelerating, giving credence to the ongoing narrative that the Fed is comfortable with inflation above its 2% target. This would erode real returns and undermine demand for longer-duration Treasuries.
On the flip side, if the Fed doesn’t cut rates five times due to sticky inflation or stronger-than-expected growth, the bond market faces another challenge: repricing. The current pricing of the 10-year Treasury reflects expectations of a lower rate environment ahead. If those expectations are dashed, yields will need to adjust higher to reflect a more hawkish Fed stance. This repricing could be swift and painful, particularly for investors who have extended duration in anticipation of rate cuts.
While rate cuts are typically supportive of fixed income markets, the underlying context matters. Cutting rates in an environment of elevated inflation could do more harm than good, while not cutting could force a painful adjustment in long-term yields. Both are potentially scary outcomes for fixed income investors. We remain neutral duration relative to benchmarks and expect the 10-year to trade around current levels or slightly higher throughout the rest of the year, barring an unexpected growth scare.
Markets Expect the Fed to Cut Rates Below 3% Next Year
Implied federal funds rate based on futures market
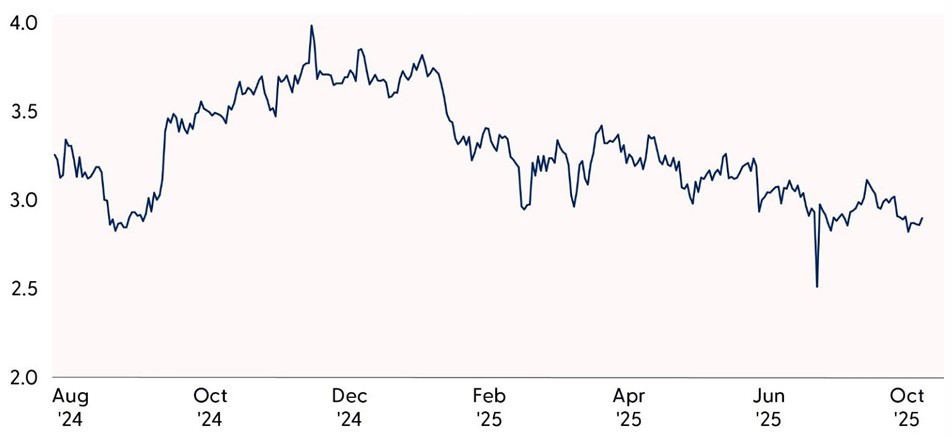
Source: LPL Research, Bloomberg, Federal Reserve, 10/23/25
Disclosures: All indexes are unmanaged and cannot be invested in directly. Past performance is no guarantee of future results.
Scare #5: Beware of Spooky Bond Market Signals
Treasury yields have been steadily declining across the curve since May, driven largely by growing expectations for Fed rate cuts. The primary catalyst behind this shift has been a marked slowdown in the labor market, prompting a repricing of fed funds rate forecasts.
While falling yields and the prospect of further rate cuts have buoyed equity markets, they also raise concerns about how much lower yields can go before signaling deeper economic trouble. Treasury yields reflect expectations for growth and inflation, so a continued downtrend in rates would likely require further signs of economic deceleration and easing price pressures. With the labor market already nearing stall speed, the scope for additional downside in yields may be limited before recession fears begin to resurface.
Technically, the path of least resistance for rates remains lower. Yields on 2-, 10-, and 30-year Treasuries are entrenched in accelerating downtrends. As shown in the “Long Bond Yields Breakdown to Multi-month Lows” chart, the 30-year yield recently broke below both its September lows and a key uptrend, leaving 4.42% and 4.30% as the major areas of support.
Despite the “spooky” signals from the bond market, the bigger risk heading into Halloween week could be the upcoming Federal Open Market Committee (FOMC) decision on Wednesday. A dovish stance could reinforce concerns about weakening economic conditions, while a hawkish surprise might prompt a reversal in yields as markets reassess potentially overly optimistic rate cut expectations. We believe either scenario could dampen risk appetite, leaving the Fed with another delicate balancing act this week.
Long Bond Yields Break Down to Multi-Month Lows
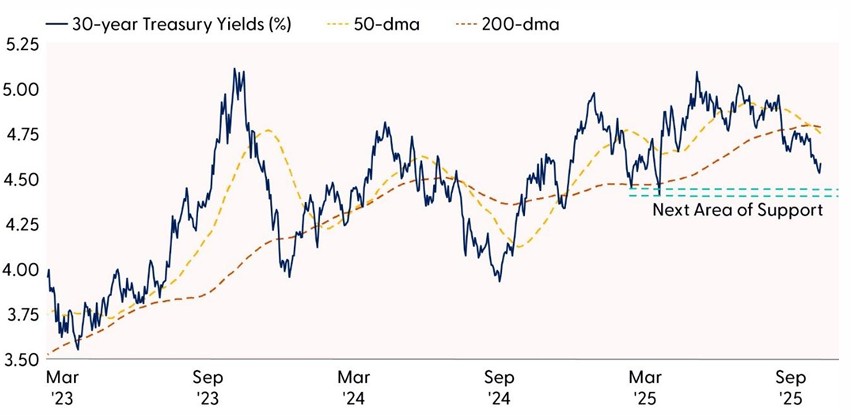
Source: LPL Research, Bloomberg, 10/23/25
Disclosures: All indexes are unmanaged and cannot be invested in directly. Past performance is no guarantee of future results.
Conclusion
This is by no means a complete list of concerns for markets. We didn’t mention geopolitical risk, including U.S. China trade tensions (appeared to cool over the weekend), Russia’s military ambitions, and corporate America’s increasing tariff burden. We didn’t mention the recent bankruptcies in the leveraged loan market, which we wrote about in “Cockroaches, Canaries, and Credit Markets” on October 20 and are not likely systemic. The promise of AI could eventually fall short. And we left out the government shutdown, which should be resolved within the next week or two with little, if any, lasting economic impact.
While this list could spook investors, and we think being a bit cautious with equities here makes sense given the likelihood of a fourth quarter pullback, we’re not advocating for selling stocks (our tactical asset allocation remains neutral equities). Our bias is to buy the next dip, as there are plenty of positives that we believe will keep this bull market going, as we discussed in our October 13 Weekly Market Commentary. Yields are low, and the Fed is cutting rates. AI capital investment is going gangbusters, fueling double-digit earnings growth. Seasonality is very favorable right now. And while deficit spending is a concern, it reduces the risk of recession in 2026. Tariff revenue is a big offset for the Treasury, helping to keep the cost of servicing the federal debt manageable.
Bottom line, when we put all of this together, we conclude that pullbacks are likely to be shallow and should be bought.
Asset Allocation Insights
LPL’s Strategic and Tactical Asset Allocation Committee (STAAC) maintains its tactical neutral stance on equities. Investors may be well served by bracing for occasional bouts of volatility given how much optimism is reflected in stock valuations, but fundamentals remain broadly supportive. STAAC’s regional preferences across the U.S., developed international, and emerging markets (EM) are aligned with benchmarks. The Committee still favors growth over value, large caps over small caps, and the communication services and financials sectors.
Within fixed income, the STAAC holds a neutral weight in core bonds, with a slight preference for mortgage-backed securities (MBS) over investment-grade corporates. The Committee believes the risk-reward for core bond sectors (U.S. Treasury, agency MBS, investment-grade corporates) is more attractive than plus sectors. The Committee does not believe adding duration (interest rate sensitivity) at current levels is attractive and remains neutral relative to benchmarks.
Important Disclosures
This material is for general information only and is not intended to provide specific advice or recommendations for any individual. There is no assurance that the views or strategies discussed are suitable for all investors or will yield positive outcomes. Investing involves risks including possible loss of principal. Any economic forecasts set forth may not develop as predicted and are subject to change.
References to markets, asset classes, and sectors are generally regarding the corresponding market index. Indexes are unmanaged statistical composites and cannot be invested into directly. Index performance is not indicative of the performance of any investment and do not reflect fees, expenses, or sales charges. All performance referenced is historical and is no guarantee of future results.
Any company names noted herein are for educational purposes only and not an indication of trading intent or a solicitation of their products or services. LPL Financial doesn’t provide research on individual equities.
All information is believed to be from reliable sources; however, LPL Financial makes no representation as to its completeness or accuracy.
All investing involves risk, including possible loss of principal.
US Treasuries may be considered “safe haven” investments but do carry some degree of risk including interest rate, credit, and market risk. Bonds are subject to market and interest rate risk if sold prior to maturity. Bond values will decline as interest rates rise and bonds are subject to availability and change in price.
The Standard & Poor’s 500 Index (S&P500) is a capitalization-weighted index of 500 stocks designed to measure performance of the broad domestic economy through changes in the aggregate market value of 500 stocks representing all major industries.
The PE ratio (price-to-earnings ratio) is a measure of the price paid for a share relative to the annual net income or profit earned by the firm per share. It is a financial ratio used for valuation: a higher PE ratio means that investors are paying more for each unit of net income, so the stock is more expensive compared to one with lower PE ratio.
Earnings per share (EPS) is the portion of a company’s profit allocated to each outstanding share of common stock. EPS serves as an indicator of a company’s profitability. Earnings per share is generally considered to be the single most important variable in determining a share’s price. It is also a major component used to calculate the price-to-earnings valuation ratio.
All index data from FactSet or Bloomberg.
This research material has been prepared by LPL Financial LLC.
Not Insured by FDIC/NCUA or Any Other Government Agency | Not Bank/Credit Union Guaranteed | Not Bank/Credit Union Deposits or Obligations | May Lose Value
For public use.
Member FINRA/SIPC.
RES-0006007-0925 Tracking #816060 | #816823 (Exp. 10/26)

