Core bond investors have experienced the worst start to the year ever. However tough this year has been so far though (and it has been tough), the potential for future returns has improved meaningfully, in our view. Starting yields tend to be a good predictor of future returns and have become more attractive in a number of markets recently. With yields on most fixed income markets moving sharply higher, now could be a good time to revisit fixed income markets.
Reasons to Own Core Bonds?
For us, the value proposition for core bonds (as defined by the bonds within the Bloomberg Aggregate Bond index) is that they tend to provide potential for liquidity, diversification (to potentially counter equity market risk), and positive total returns to portfolios. Unfortunately, none of those values are 100% certain all the time. Like all markets, fixed income investing involves risks and at times, negative returns. However, despite the historically poor start to the year, the value proposition for core bonds has actually improved recently. Investing is a forward-looking exercise, and with the back up in yields already taking place this year, we believe now could be as good as it’s been in quite some time for core bonds.
Importantly, yields are moving higher because of the expectations of higher short-term interest rates and not an increase in credit risk. Coming into the year, markets were only expecting one or two short-term interest rate hikes by the Federal Reserve (Fed) this year with most of the hikes expected to come in 2023. However, markets have aggressively re-priced the number of expected Fed rate hikes and now expect as many as 11. As such, the yield on the 10-year Treasury security has doubled this year after increasing around 100 basis points (1.00%) off its lows in 2020. The 260 basis point (2.6%) move higher that has already taken place this cycle is the biggest move higher in yields since 1994, when rates moved higher by 280 basis points—and that was at the end of the rate hiking cycle. With so many rate hikes priced in at this point, we think the worst is behind us.
So have rates peaked? Historically, rates have tended to move a lot before the first rate hike, (like they’ve already done this year) but they still move marginally higher throughout the rate hiking process and don’t actually make a top until the Fed stops raising rates. This cycle has only really just started. That doesn’t mean we will see significantly higher yields—we don’t think we will—but we could see 3.25-3.35% on the 10-year this year, which would likely be the top in yields for this cycle, in our view. However, we still expect yields to trade in a range between 2.75-3.0% for most of the year and then fall slightly from current levels throughout the year with the 10-year Treasury yield ending the year around 2.5%. So, as mentioned, we have seen a big move higher in rates this year but we do think the worst is behind us.
No More Tina?
TINA, or “there is no alternative,” has been a big reason diversified asset allocation portfolios have been overly geared towards equities over the past few years. The relative attractiveness of equities over fixed income was undeniable when interest rates were hovering around all-time lows. Now interest rates have moved higher recently, though the relative attractiveness between the two broad asset classes is much more balanced (albeit still leaning favorable towards equities by at least one measure as we explain in this blog found here).
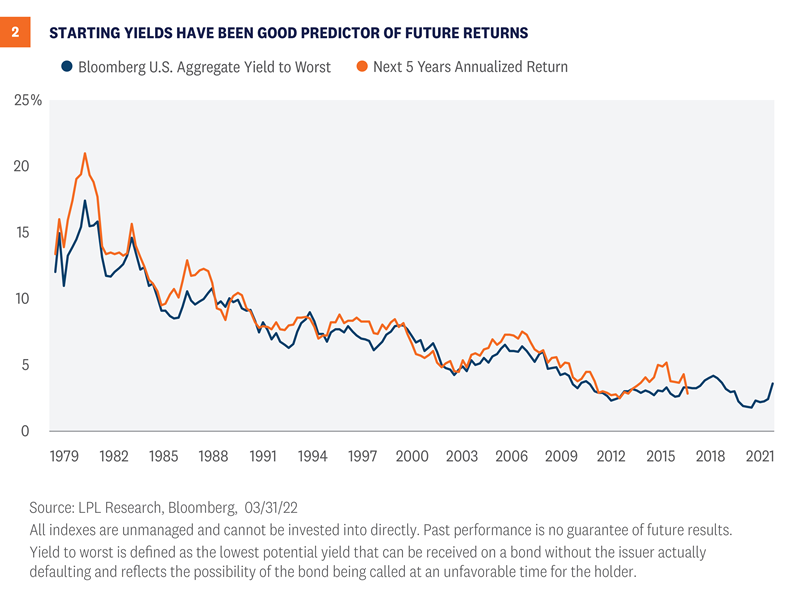
But, for investors unwilling or uninterested in taking on additional equity risks, there are a number of fixed income markets with yields trading above long-term averages. As seen in Figure 1, the yield-to-worst on most fixed income asset classes is hovering around the highest yields we’ve seen in a decade. And for the Bloomberg Aggregate index, which is the broad based core bond index, outside of two months in 2018, yields are the highest they’ve been since 2010. Since starting yield levels have been a good predictor of future returns (see below), with yields increasing meaningfully this year, future returns look more attractive than they have in years. With interest rates so low over the past few years, the back-up in yields could be an attractive opportunity for suitable income-oriented investors. And while we can’t guarantee that interest rates won’t go higher, at current yields, the risk/reward for owning fixed income has improved, in our opinion.

As mentioned, for many fixed income asset classes, starting yield levels have been an accurate predictor of future returns. Bonds, for the most part, are unique in their structures in that, absent defaults, expected returns are largely determined by starting yields. That is, we tend to have a pretty good idea what to expect out of many fixed income instruments over time because coupon and principal payments are known in advance and contractually obligated. As such, whether you’re invested in an individual bond, an investment that tracks an index like the Bloomberg Aggregate index, [Figure 2] or a strategy designed to actively outperform an index, returns are largely predicated on starting yields. And this is true if you hold the fixed income instrument to maturity (for an individual bond) or at least five years (for a portfolio of bonds) regardless of what interest rates do in the interim. That is, if you buy and hold a fixed income investment, the short-term volatility you experience due to changing interest rate expectations is just volatility. It has very little bearing on the actual total return if held to maturity (or if held to the average maturity of a portfolio of bonds).

Diversification Benefits of Bonds May Be Improving
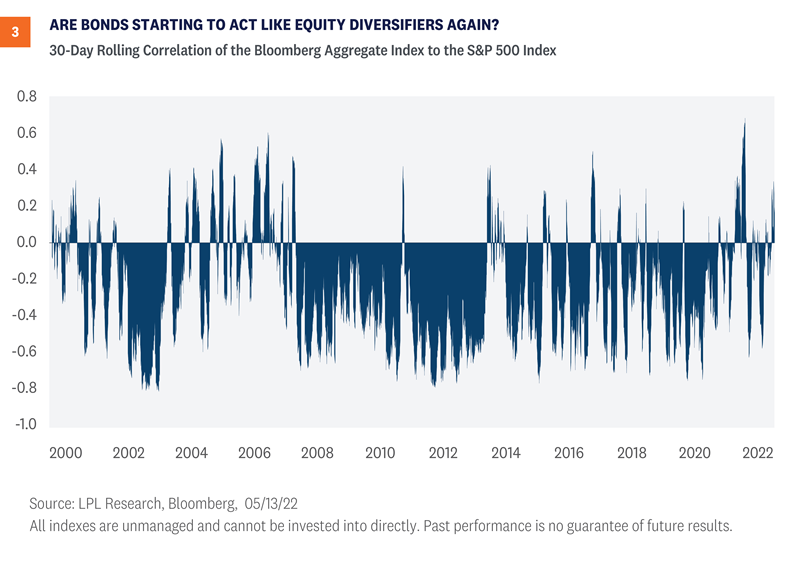
Since 2000, the correlation between stocks and bonds has generally been negative, although there has been considerable variation with that relationship. And at times, the relationship between stocks and bonds has, in fact, been positive (from 1965 to 2000, correlation was actually slightly positive due to higher inflation and more frequent inflationary shocks). So, the historical correlation between stocks and bonds is actually close to zero—meaning it’s generally noisy. In other words, it isn’t that uncommon to see equity and bond prices moving lower (or higher) at the same time.
However, now that interest rates have moved off the all-time lows set back in August 2020, there is more of a cushion to act like a diversifier during equity market drawdowns, which is what we’ve seen during the most recent equity market stresses over the past few weeks. Since the start of May, equities are down over 6% whereas core bonds are positive. And without any additional macroeconomic shocks driving the divergent returns, it’s comforting to see bonds providing that equity buffer, albeit over a very short time horizon. The back-up in yields this year has certainly been painful, but the ability for fixed income to act as an equity buffer has increased, in our view. As bond and equity markets both move past the aggressive repricing of Fed rate hikes that have caused both markets to sell off this year and grapple with a potential slowdown in economic growth, bonds have the potential to mitigate the risk in portfolios again as we move through the year.

Conclusion
Core bonds have been a staple in diversified asset allocations. However, with returns as negative as they’ve been this year, investors may be undergoing a rethink of the utility of core bonds. We think that may be a mistake. We still think the value proposition for core bonds remains. Liquidity, equity diversification, and total returns are all valuable properties core bonds bring to diversified portfolios—and each of those value propositions have improved recently. Moreover, bonds are unique in their structures in that coupon and principal payments are, for the most part, guaranteed (unless the issuer defaults) and the primary factors of long-term total returns. The price volatility we’ve seen so far this year doesn’t impact those payments. And with yields higher in many markets, now may be a good time for suitable investors to start looking at additional investment opportunities within fixed income.
Click here to download a PDF of this report.
IMPORTANT DISCLOSURES
This material is for general information only and is not intended to provide specific advice or recommendations for any individual. There is no assurance that the views or strategies discussed are suitable for all investors or will yield positive outcomes. Investing involves risks including possible loss of principal. Any economic forecasts set forth may not develop as predicted and are subject to change.
References to markets, asset classes, and sectors are generally regarding the corresponding market index. Indexes are unmanaged statistical composites and cannot be invested into directly. Index performance is not indicative of the performance of any investment and do not reflect fees, expenses, or sales charges. All performance referenced is historical and is no guarantee of future results.
Bonds are subject to market and interest rate risk if sold prior to maturity. Bond values will decline as interest rates rise and bonds are subject to availability and change in price.
There is no guarantee that a diversified portfolio will enhance overall returns or outperform a non-diversified portfolio. Diversification does not protect against market risk.
Any company names noted herein are for educational purposes only and not an indication of trading intent or a solicitation of their products or services. LPL Financial doesn’t provide research on individual equities.
All information is believed to be from reliable sources; however, LPL Financial makes no representation as to its completeness or accuracy.
US Treasuries may be considered “safe haven” investments but do carry some degree of risk including interest rate, credit, and market risk. Bonds are subject to market and interest rate risk if sold prior to maturity. Bond values will decline as interest rates rise and bonds are subject to availability and change in price.
The Bloomberg Aggregate U.S. Bond Index represents securities that are SEC-registered, taxable, and dollar denominated. The index covers the U.S. investment-grade fixed rate bond market, with index components for government and corporate securities, mortgage pass-through securities, and asset-backed securities.
The Standard & Poor’s 500 Index (S&P500) is a capitalization-weighted index of 500 stocks designed to measure performance of the broad domestic economy through changes in the aggregate market value of 500 stocks representing all major industries.
All index data from FactSet.
This research material has been prepared by LPL Financial LLC.
Securities and advisory services offered through LPL Financial (LPL), a registered investment advisor and broker-dealer (member FINRA/SIPC). Insurance products are offered through LPL or its licensed affiliates. To the extent you are receiving investment advice from a separately registered independent investment advisor that is not an LPL affiliate, please note LPL makes no representation with respect to such entity.
| Not Insured by FDIC/NCUA or Any Other Government Agency | Not Bank/Credit Union Guaranteed | Not Bank/Credit Union Deposits or Obligations | May Lose Value |
RES-1164201-0522 | For Public Use | Tracking # 1-05284424 (Exp. 5/23)


